In today’s modern workplace, finding the right internal communication and employee engagement platform is key to your organization's success. The right software can boost connection, collaboration, and productivity. That translates to better staff retention and better business results.
Of course, the wrong software can get in the way of company communication and engagement. Some platforms exclude the members of your workforce who don’t sit at a desk. Some complicate comms to the point that employees stop engaging. So finding a platform that meets the unique needs of your organization takes time and research.
Workvivo has long been a popular internet option. But there’s lots of other software available, each with its advantages and disadvantages — and at a variety of different price points. Here, we take a look at ten Workvivo alternatives to help you find a solution with all the features and functionality your organization needs.
What to look for in a Workvivo replacement
So what makes a good Workvivo replacement? What should you be looking for? Here are a couple of factors to consider.
Ease of use and accessibility. A user-friendly interface ensures that all employees, regardless of technical ability, can navigate and engage with the platform easily.
Integration capabilities. Look for a platform that seamlessly integrates with your existing tools and systems, such as HR software or project management platforms, to streamline workflows and enhance efficiency.
Communication channels. The best communication tools provide a variety of communication channels. Look for two-way communication, a social-media-style news feed, polls, 1:1 chats, video conferencing, and a hub of company resources.
Customization and personalization options. Customization options allow you to tailor the platform to match your technical requirements and branding. Personalization allows you to adapt interfaces and content so they’re relevant to each individual employee.
Scalability. Your chosen solution needs to grow with you. So choose a platform that can accommodate your organization's expansion without sacrificing performance or user experience.
Analytics. To learn more about employee engagement and platform usage, you need robust analytics and reporting functions. Data should be relevant, easy to understand, and easy to act upon.
Adoption and engagement. Look at user adoption and engagement figures. If lots of other organizations (like yours) have had a successful experience with a particular software, you can be much more confident that you will too.
Top Workvivo alternatives in 2025
1. Blink
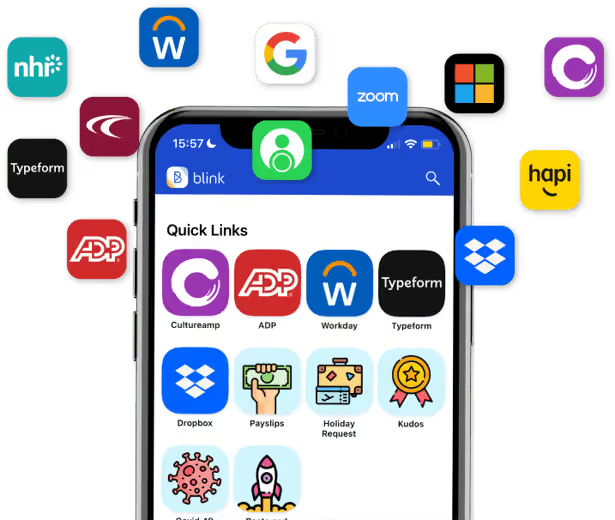
Blink is a mobile-first, modern intranet that supports employee communication and engagement across both desktop and mobile devices.
This platform facilitates two-way communication, surveys, employee recognition, and content sharing. With robust analytics, managers get to know how employees are engaging with the intranet and the organization. And with excellent integrations, you can create a digital hub where both desk-based and frontline employees can access essential workplace tools.
{{mobile-desktop-main="/image"}}
Benefits
Mobile-first: The Blink platform offers exactly the same features and functionality on mobile as it does on desktop and it doesn’t require a company email address. So all workers get a comprehensive and user-friendly experience.
Personalized internal communications: A tailored news feed ensures employees receive relevant information based on their teams, interests, and roles.
Advanced analytics: Robust analytics capabilities provide actionable employee engagement insights, enabling data-driven decision-making.
Deep integrations: Blink's super-app acts as the digital front door for your organization, so employees can access comms, documents, training, and HR essentials, all in the same place.
Customer support: Blink customers work with a dedicated customer success manager who helps to optimize the app for the organization and ensure worker adoption.
Challenges
Frontline-first: Blink was primarily designed for frontline workers, though there is a best-in-class desktop application so that all employees can utilize.
Pricing
Pricing is available on request.
Reviews
Capterra: 4.6/5
G2: 4.7/5
2. Slack
Slack is one of the most popular workplace communication apps, especially for organizations that have employees working from home. It’s known for its intuitive interface and a variety of third-party integrations. Slack’s supported platforms include web, iOS, and Android.
Benefits
Real-time messaging: Instant messaging fosters seamless communication and collaboration among team members, while separate ‘channels’ help to keep topics separate and organized.
Integration capabilities: Integrates with over 2,500 third-party tools and services, so you can incorporate the intranet and productivity features that Slack lacks.
Customization: Offers a range of customization options to tailor the platform to organizational and individual needs.
Challenges
Email addresses required: Employees who don’t have access to an email address will not be able to join Slack.
Limited file storage: Free plans only allow you to access messages and documents for up to 90 days. This may not be enough for organizations with extensive data needs.
Navigation: You can view conversations in the left sidebar but if you have multiple conversations on the go, it can be hard to find the chat you’re looking for.
Notifications: Slack’s constant notifications can be distracting for workers.
Pricing
A free version supports 1:1 meetings and messages. Paid plans start from $7.25 USD per user per month, paid annually.
Reviews
Capterra: 4.7/5
G2: 4.5/5
3. Jostle
Jostle is a cloud-based intranet software provider for companies looking to streamline their internal communication. It helps organizations align teams, share news, and recognize employee contributions.
Benefits
Easy onboarding: Jostle is a simple platform. Many customers say Jostle is easy to learn and use.
Employee engagement tools: Customers enjoy the ability to share news, documents, and recognition with their team.
Content filtering: You can segment your audience by department, location, and more when sharing content.
Jostle TV: Jostle has a cool feature that allows you to transfer content to TV screens in your workspace.
Challenges
Limited analytics: Jostle's analytics capabilities are less robust compared to other platforms, limiting insights into employee engagement and performance.
Requires a work email: Customers mention difficulty with frontline employee adoption as workers don’t want to use their personal email address to access work platforms.
Lack of customization: You can’t remove features that aren’t relevant to your business, which can make for a confusing and cluttered user interface (UI).
Pricing
Monthly pricing starts at $2.77 USD per user, based on a team of 500 people.
Reviews
Capterra: 4.4/5
G2: 4.5/5
4. Interact
Interact is one of the top intranet platforms for those looking for something fun and interactive, rather than something corporate. It combines a social feed, internal communication software, and a collaboration tool.
Benefits
Intranet solutions: Interact offers intranet solutions designed to drive employee engagement and collaboration across the organization.
Employee feedback: This platform supports polls and surveys, so you’ll find it easy to get feedback from your workforce.
Customization: Interact has flexibility in how your interface looks and feels, allowing customization for what you are looking for.
User support: Interact provides dedicated customer support and resources to assist organizations in maximizing platform usage and effectiveness.
Challenges
Limited scalability: Interact's capabilities may be limited in scalability and customers don't often have much input into product development or feedback. For this reason, Interact can feel outdated.
Analytics limitations: Interact has limited analytics functions for customers to engage and learn from.
Time-intensive: For SMEs, Interact can prove difficult. You may need a dedicated team to manage this platform effectively.
Cost: Some Interact features — like pulse surveys and advanced analytics — come at an additional cost.
Pricing
Pricing is available on request.
Reviews
Capterra: 4.6/5
G2: 4.6/5
5. Microsoft Teams
Microsoft Teams is a team collaboration app. It integrates with Office 365 to provide chat, meeting, and document-sharing tools. And it allows remote workers to collaborate in real-time.
Benefits
Office 365 integration: Seamless integration with Office 365 tools enhances productivity and collaboration within teams.
Collaboration features: Features such as chat, video conferencing, and document sharing facilitate real-time collaboration and communication.
Security and compliance: Microsoft Teams prioritizes security and compliance, providing peace of mind for organizations handling sensitive information.
Navigation: Each channel comes with file storage so it’s easy to find the documents related to the conversations you’re part of.
Challenges
Complexity: Microsoft Teams' extensive feature set may lead to complexity, requiring users to invest a lot of time in learning the platform.
Pricing structure: While basic features are included in Office 365 subscriptions, additional functionalities incur extra costs.
Resource intensiveness: Microsoft Teams may require significant resources for implementation, customization, and ongoing maintenance, particularly for large organizations.
Poor internal communication: You only get a limited number of channels and may find it difficult to get critical messages to cut through.
Pricing
You can try Microsoft Teams for free for a month. After that, the cheapest plan (the Essentials plan) costs $4.00 USD per user per month, paid annually.
Reviews
Capterra: 4.5/5
G2: 4.3/5
6. Igloo Software
Igloo is a digital workplace experience software that offers a community, recognition, resources, and more to employees.
Benefits
Digital workplace solutions: Igloo Software offers comprehensive solutions for creating digital workplaces, including intranet, collaboration, and knowledge management tools.
Collaboration features: Igloo provides a range of collaboration features such as document sharing, project management, and task tracking to enhance teamwork and productivity.
Powerful analytics: This platform provides excellent analytics that help you to optimize content, find key creators, and understand user flow.
Challenges
Integration challenges: Integrating Igloo software with other systems or tools isn’t straightforward and may require additional development resources.
Learning curve: There’s a learning curve with Igloo that can impact initial usability and adoption.
Lack of customization: Customers sometimes face challenges with customizing pages and a lack of flexibility within the product.
Pricing
Pricing is available upon request. Although Igloo does say that pricing typically starts at around $20,000 USD per year for an organization.
Reviews
Capterra: 4.5/5
G2: 4.2/5
7. Simpplr:
Simpplr is a modern, social-media-style intranet with an attractive interface. It was designed for enterprise and medium-sized organizations and it provides a digital hub where employees can share information.
Benefits
Great customer support: Users appreciate the hands-on support from the Simpplr team, which continues post-launch with training resources and ongoing updates.
A modern, minimal interface: Simpplr looks great but keeps visuals simple, which encourages adoption, reduces the learning curve, and makes it easy for users to find what they’re looking for.
AI assistance: Simpplr is an ‘AI-powered’ intranet. You can use AI to provide employee guidance, automate HR processes, produce content, and summarize conversations.
Personalization: The platform’s personalization features allow you to target information to specific employees, based on their activity, roles, locations, and interests.
Challenges
Lack of customization: Simpplr doesn’t have as much design flexibility and doesn’t provide as many templates as other software on this list.
Integrations: Some users say they struggled to integrate the intranet with some of their third-party apps.
Pricing
Pricing is available on request.
Reviews
Capterra: 4.8/5
G2: 4.7/5
8. Staffbase
The Staffbase intranet works well for big corporations with both dispersed and desk-based employees. It helps teams communicate more effectively, with the help of content distribution, instant notification, and integrated third-party tools.
Benefits
Easy-access resources: Staffbase makes it easy for employees to publish and access documents, videos, and images via a single portal.
Reporting: The platform has in-built reporting features so you can easily see how many employees use the platform and interact with your posts.
Customization: You can customize the Staffbase interface to match the branding of your organization.
HR functionality: With communication tools, surveys, and employee self-service tools, Staffbase makes life easier for your HR team.
Challenges
Limited analytics: Staffbase analytics isn’t comprehensive enough to tell you how users are searching the intranet.
Cost: Some small and medium-sized business users say that Staffbase is expensive. You also need to pay more if you want to add Content Review and Approval Workflow modules.
Limited mobile functionality: Staffbase does provide a mobile app but there aren’t many out-of-the-box functions for frontline workers.
Pricing
Pricing is available on request.
Reviews
Capterra: 4.8/5
G2: 4.6/5
9. LumApps
LumApps provides intranet software for desk-based organizations. It’s a type of social intranet that promotes effective employee communication, document sharing, and employee engagement.
Benefits
Google and Microsoft integrations: LumApps integrates well with Google Workspace and Microsoft 365.
Translation capabilities: LumApps makes it easy to translate content into 30+ languages, which is great for multilingual teams.
Customization: This platform offers good customization options, allowing you to tailor UX and content to each region and market within your company.
Employee journeys: You can segment your audience and create a personalized employee journey with automated campaigns.
Challenges
Integrations: While integration with Microsoft 365 and Google Workspace is excellent, other integrations are sometimes not as effective.
Slow updates: Users complain that the LumApps team is slow at implementing essential updates and improvements.
Admin user experience: The end-user experience is good. But some admins say that the platform clunky and slow to use.
Pricing
Pricing is available on request.
Reviews
Capterra: 4.1/5
G2: 4.2/5
10. Unily
Unily is an employee experience platform, designed to connect, inform, and engage employees. Aimed at large and more complex organizations, it provides a range of internal communication and intranet features.
Benefits
Good UX: End-users find the user interface (UI) attractive and easy to use. Strong UX aids platform adoption and engagement.
Personalization: Unily makes it easy to target the right information at the right employees, so everyone can enjoy timely, relevant content.
Flexibility: Integrations and customizations mean platform managers have a lot of flexibility to create the design and functionality they need.
Broadcast emails: Unily’s email newsletter feature allows you to create, schedule, and send emails to in-house staff and non-platform users, too.
Challenges
Complexity: Unily is a comprehensive tool but this means it takes a lot of time to set up. It also requires a lot of management to ensure the front-end experience doesn’t become overwhelming.
Cost: Unily customers get a lot for their money but it’s one of the priciest platforms on the market.
Learning curve: For admins, the content management system can feel complicated and training is required to get the most out of it.
Pricing
Pricing is available on request.
Reviews
Capterra: 4.6/5
G2: 4.5/5
In summary
Workvivo may be a popular choice for employee communication and engagement. But it’s not the only platform out there. There are lots of Workvivo alternatives, each with its own strengths and weaknesses.
For frontline organizations, Blink makes an unbeatable alternative to Workvivo. With Blink, you get a user-friendly, mobile-first app that gives every employee access to company comms, connection, and culture.
You put a news feed, group messaging, employee recognition, company resources, and survey functions at the fingertips of your workforce. You also give workers easy access (via single sign-on) to the digital hub and all your workplace tools.
The Blink app creates a sense of belonging for frontline employees, bringing them closer to your organization while improving collaboration and productivity, too. It also supports high levels of user adoption and platform engagement.
Take a look at our Customer Stories to find out how other organizations have benefitted from using Blink.
3. Is Blink a good fit for enterprise and hybrid workforces?
Yes. Blink is built for scalability and flexibility, making it ideal for enterprises, hybrid teams, and multi-location organizations. With powerful targeting, analytics, and role-based access, it supports both corporate and distributed teams equally well.
4. Why choose Blink over other Workvivo competitors?
Blink brings communications, resources, and tools into a single hub — improving productivity, reducing app sprawl, and increasing employee engagement. It's intuitive to use, quick to deploy, and trusted by organizations across industries like healthcare, tech, retail, and logistics.
5. How does Blink pricing compare to Workvivo?
Blink offers transparent, scalable pricing based on your organization's needs — often delivering better value than Workvivo, especially at scale. There’s also a free plan for eligible nonprofits and an affordable upgrade path to enterprise-grade features.
Why teams choose Blink over Workvivo
Workvivo and Blink share a lot of surface-level features, which is exactly why the details matter. See our full side-by-side comparison on adoption, mobile experience, and pricing — and see why teams at McDonald's, Domino's, and Chick-fil-A chose Blink's mobile-first, no-corporate-email approach to reach every frontline worker.

.avif)
.png)
.avif)








.avif)